2026 Top Food Waste Treatment Equipment Suppliers?
Food waste is not one uniform material. A hotel kitchen may produce wet scraps and cooking oil, while a food processor handles fibrous residues, packaging contamination, or seasonal surges. The right Food Waste Treatment Equipment depends on those details, not just a supplier’s product page. In 2026, buyers comparing suppliers should look beyond headline capacity and ask how equipment performs during ordinary, messy operating conditions.
Some systems reduce volume through dewatering or grinding; others support composting, anaerobic digestion, or further processing. Each approach has different space, labor, maintenance, and output requirements. A compact unit may fit behind a restaurant kitchen, but it may not suit a busy institutional site. Ask suppliers for throughput data, installation needs, cleaning procedures, service coverage, and references from comparable facilities. Request a site assessment where possible. Details matter.
This guide examines suppliers through practical criteria rather than treating “top” as a universal ranking. Availability, technical support, feedstock compatibility, and total operating costs can vary by country and project. Specifications also deserve a second look: quoted capacity may depend on moisture, sorting, and hours of operation. That is easy to overlook. No supplier can be the best fit for every buyer, and published claims should be checked against documented performance. The aim is to help readers ask sharper questions, compare realistic options, and identify equipment that fits the waste stream they actually have—not the one they wish they had.
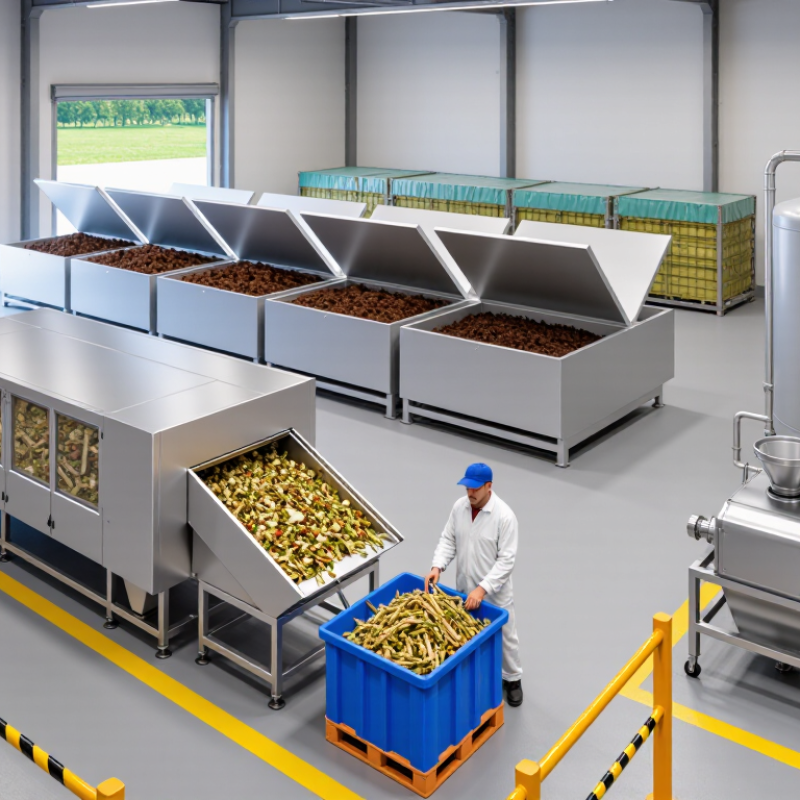
Food Waste Treatment Equipment: Scope, Feedstocks, and System Boundaries
Food waste treatment equipment begins with a clear boundary: what enters the plant, what the process changes, and where every output goes. The UNEP Food Waste Index Report 2024 estimated 1.05 billion tonnes of food waste in 2022 across households, food service, and retail. Households accounted for 60%, food service 28%, and retail 12%. These figures include edible and inedible parts, so they do not directly represent the feedstock available to a treatment facility. The distinction matters.
Typical inputs include kitchen scraps, preparation residues, unsold food, and production waste. Their moisture, packaging, and contamination levels can vary sharply. A system designed for clean, source-separated scraps may struggle with wrapped products or excess liquids. Boundaries should cover receiving, sorting, size reduction, processing, and outputs such as digestate, wastewater, and captured energy. They should also state whether transport and rejected material are included. Small details matter. The World Bank’s What a Waste 2.0 report identifies food and green waste as a major share of global municipal solid waste, but local composition differs. Supplier comparisons therefore need consistent feedstock assumptions and output measurements. Real sites are rarely so tidy. That gap deserves scrutiny.
Global Waste Baseline: 1.05 Billion Tonnes in 2022 (UNEP, 2024)
UNEP’s Food Waste Index Report 2024 estimates that 1.05 billion tonnes of food were wasted worldwide in 2022. The total covers households, food service, and retail. It represents about 19% of food available to consumers. That is substantial. Most of this waste came from households, so treatment equipment is only one part of the response.
For food waste that cannot be prevented, equipment suppliers can help facilities handle scraps more consistently. A practical assessment should start with measured daily volumes, not a brochure’s maximum capacity. Kitchens need to know whether a unit can process mixed scraps, handle cleaning routines, and fit available floor space. Operators should also compare energy and water use, maintenance needs, and how output quality is monitored. Small details matter: a blocked inlet during a busy lunch shift can disrupt the whole workflow.
The 2022 global figure is a useful baseline, but it does not describe every site equally. Seasonal changes and local sorting habits can alter what reaches a machine. Pilot tests using real food scraps are more informative than assumptions. Imperfectly, many purchasing plans still emphasize throughput over prevention and measurement. Suppliers who document operating conditions and limitations make comparisons more dependable.
Core Technologies: Dehydration, Anaerobic Digestion, and Composting
Food waste treatment equipment suppliers should explain how each system handles real feedstock, not just ideal samples. Dehydration units reduce water content using heat and agitation. Operators should check cycle time, energy use, odor control, and the condition of the dried output. A tray of mixed food scraps can behave differently from a steady stream of vegetable peelings. Ask for trial results using waste similar to your own.
Anaerobic digestion suits facilities with consistent organic material and space for tanks. Microorganisms break down waste without oxygen, producing biogas and a nutrient-rich digestate. The process needs careful monitoring of temperature, mixing, and feed consistency. Small changes matter. Suppliers should clarify what pretreatment is required and how they support routine maintenance. A technically impressive system may still struggle when incoming waste varies sharply by day.
Composting uses airflow, moisture, and microbial activity to turn organics into a stable material. It can be simpler to understand, but not effortless. Too much moisture can create odors; poor aeration can slow decomposition. Ask suppliers about screening, bulking materials, operating labor, and space requirements. No single technology fits every site, and equipment comparisons can feel messy when vendors measure performance differently. A site visit and a measured waste audit often reveal details that brochures leave out.
2026 Top Food Waste Treatment Equipment Suppliers? - Core Technologies: Dehydration, Anaerobic Digestion, and Composting
| Technology |
Core process |
Typical operating conditions |
Indicative processing time |
Main outputs |
Equipment and evaluation points |
| Dehydration / thermal drying |
Uses heat, and sometimes mechanical separation, to remove moisture and reduce the mass and volume of food waste. |
Conditions depend on dryer design, feedstock, and target moisture. Systems generally require heat, ventilation, and control of exhaust air and odors. |
Often several hours to about one day per batch or processing cycle; continuous systems are sized by throughput rather than batch time. |
Dried, reduced-volume material and water vapor. The dried material is not automatically a certified fertilizer or pathogen-free product. |
Check installed heating capacity, energy use per tonne, moisture target, odor treatment, cleaning access, and the permitted destination for the dried material. |
| Anaerobic digestion (AD) |
Microorganisms break down organic material in an oxygen-free reactor, producing biogas and digestate. |
Common mesophilic operation is around 35–38°C. Biogas commonly contains approximately 50–70% methane; composition varies with feedstock and process conditions. |
Typical reactor retention is roughly 15–30 days, with actual design depending on feedstock, temperature, loading, and process configuration. |
Biogas for heat, electricity, or upgrading, plus digestate that may require dewatering, treatment, and regulatory approval for use. |
Assess preprocessing and contaminant removal, gas storage and safety systems, mixing, heat demand, digestate management, and access to a gas or energy user. |
| Aerobic composting |
Microorganisms decompose organic material in the presence of oxygen. Bulking materials may be added to improve structure and airflow. |
Requires adequate oxygen, moisture, and a suitable carbon-to-nitrogen balance. Active piles commonly reach thermophilic temperatures of about 55–65°C when well managed. |
Active composting often takes several weeks; curing may add weeks to months, depending on the process and required product maturity. |
Stabilized compost, along with water vapor and carbon dioxide. Product quality depends on feedstock separation and process control. |
Compare turning or aeration systems, bulking-agent supply, leachate collection, odor control, curing area, and local compost-quality requirements. |
| Selection considerations |
Compare suppliers using the same feedstock assumptions and reporting basis. Confirm guaranteed throughput, contamination limits, energy and water consumption, emissions and odor controls, residuals handling, maintenance requirements, site footprint, permitting needs, and the intended end use of all outputs. |
Operating ranges are indicative, not equipment guarantees. Actual performance varies with feedstock composition, contamination, system design, operating practice, and local regulations.
Comparing 2026 Suppliers by Capacity, Energy Use, and Verified Installations
For a 2026 supplier comparison, headline capacity is only a starting point. The UNEP Food Waste Index Report 2024 estimates that 1.05 billion tonnes of food waste arose in 2022; households generated 60%, food service 28%, and retail 12%. That varied feedstock matters. Compare sustained tonnes per day using waste similar in moisture, packaging, and contamination to your own—not a short peak-rate demonstration.
Energy figures need the same discipline. Request metered kWh per wet tonne, operating hours, water use, and any energy consumed during standby. Ask suppliers to explain test conditions and provide raw commissioning records. A smaller machine may perform better on an irregular, low-volume stream. I would be cautious about comparing figures that exclude cleaning, drying, or downtime. Real plants are messy.
Verify installations with dated site references, throughput logs, and uptime records from comparable facilities. Check whether the equipment handles seasonal volume changes and whether operators can clear a jam without extended stoppages. The UNEP figures describe the scale and sources of waste, not equipment performance; they cannot validate a supplier’s claims. That distinction is easy to miss. A polished case study is useful, but measured results from a similar feedstock are stronger evidence.

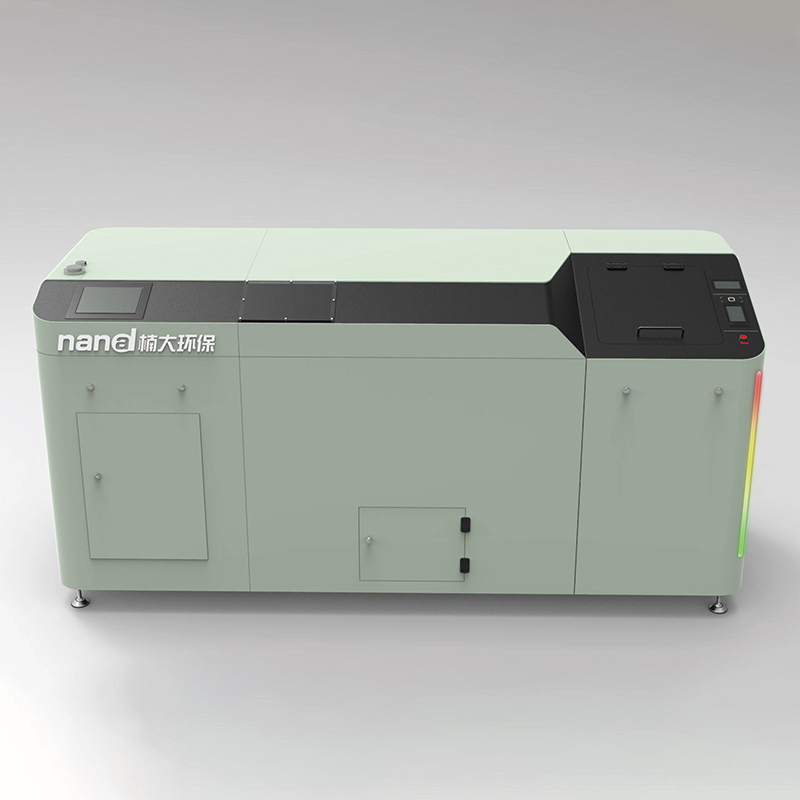 Nanda Trans Series-200
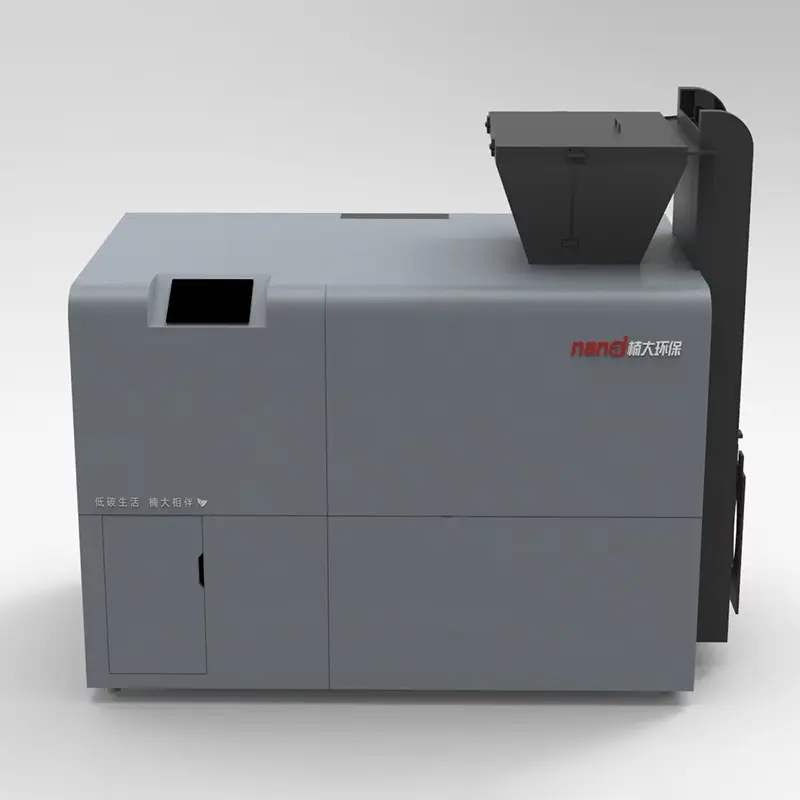 Nanda Trans Series-500
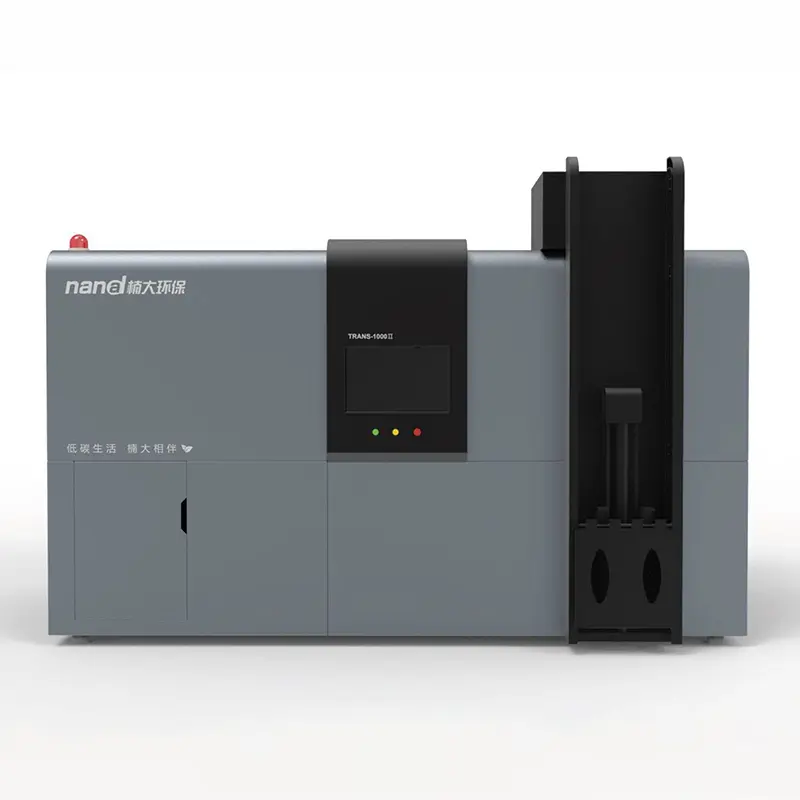 Nanda Trans Series-1000
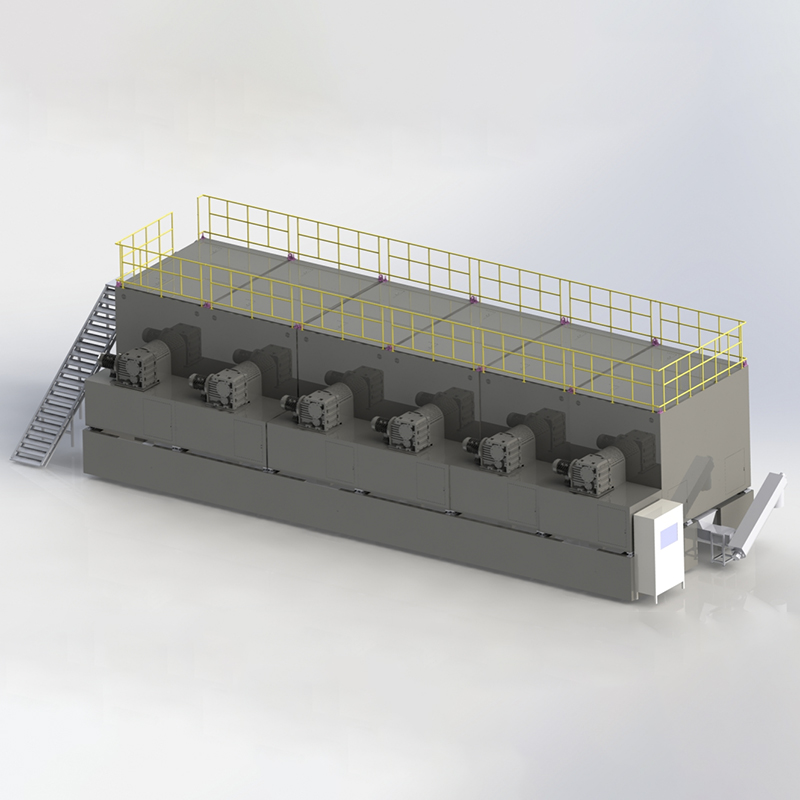 Nanda Trans Series-30000
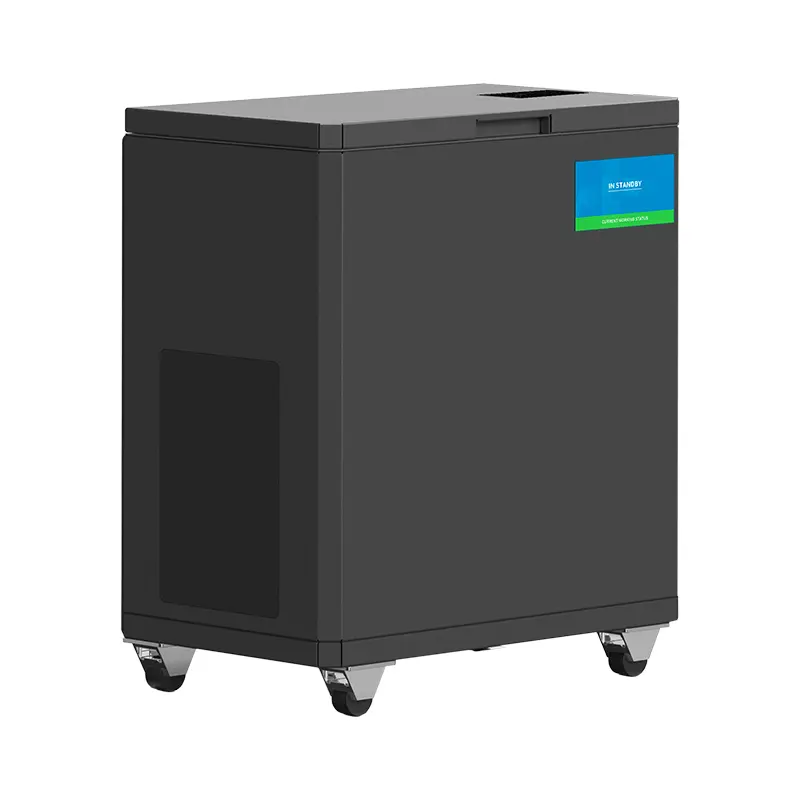 Nanda Thermax Series-100
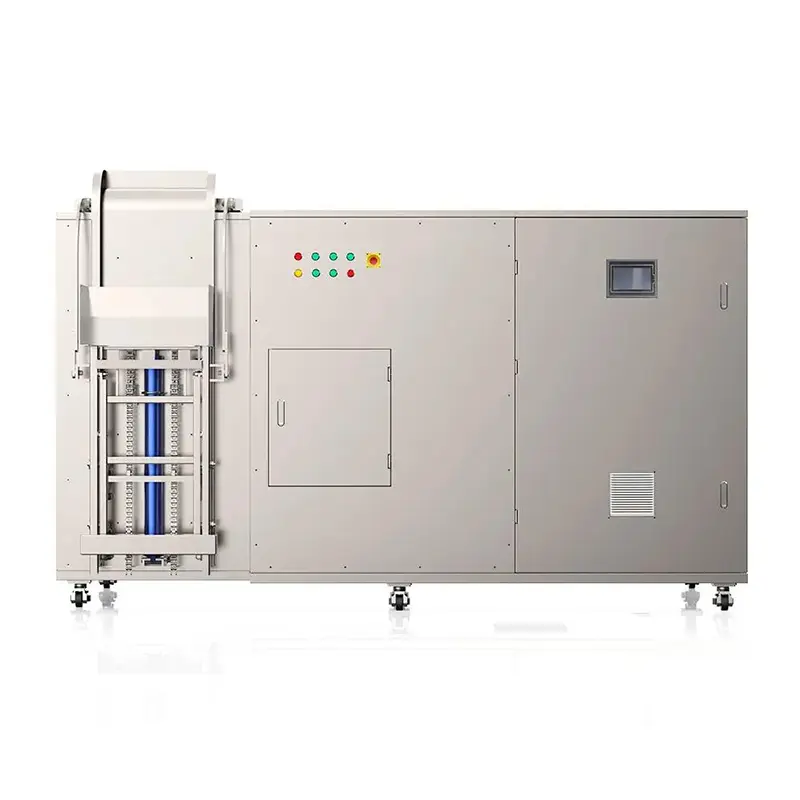 Nanda Thermax Series-200
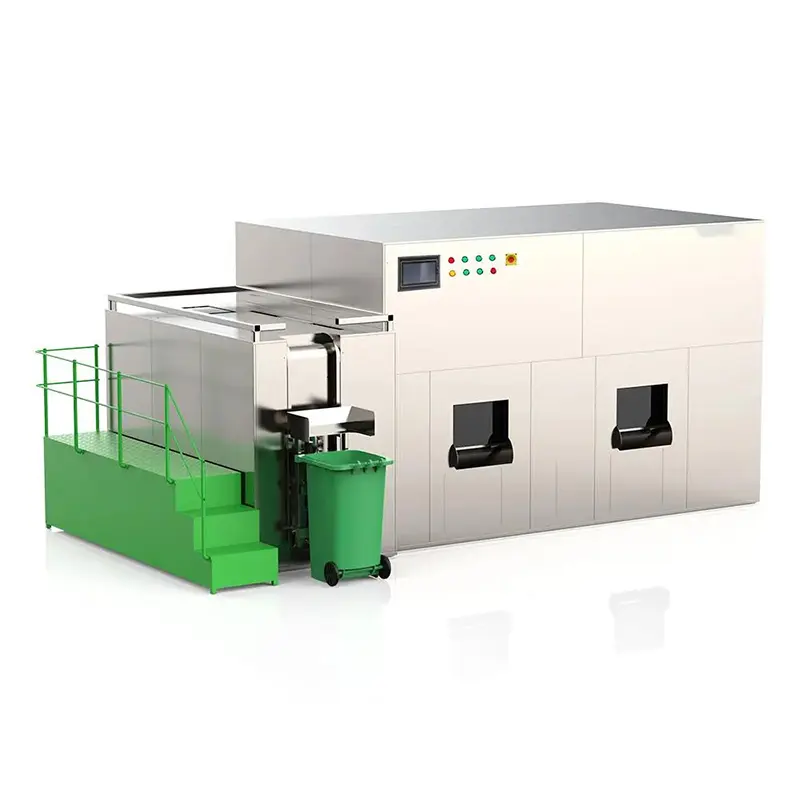 Nanda Thermax Series-2000
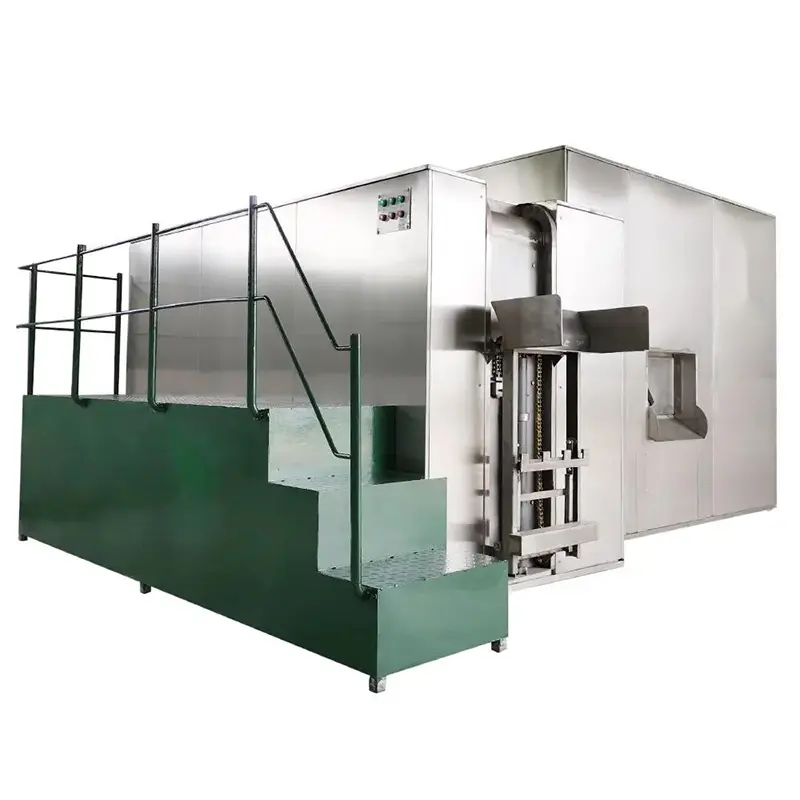 Nanda Thermax Series-10000
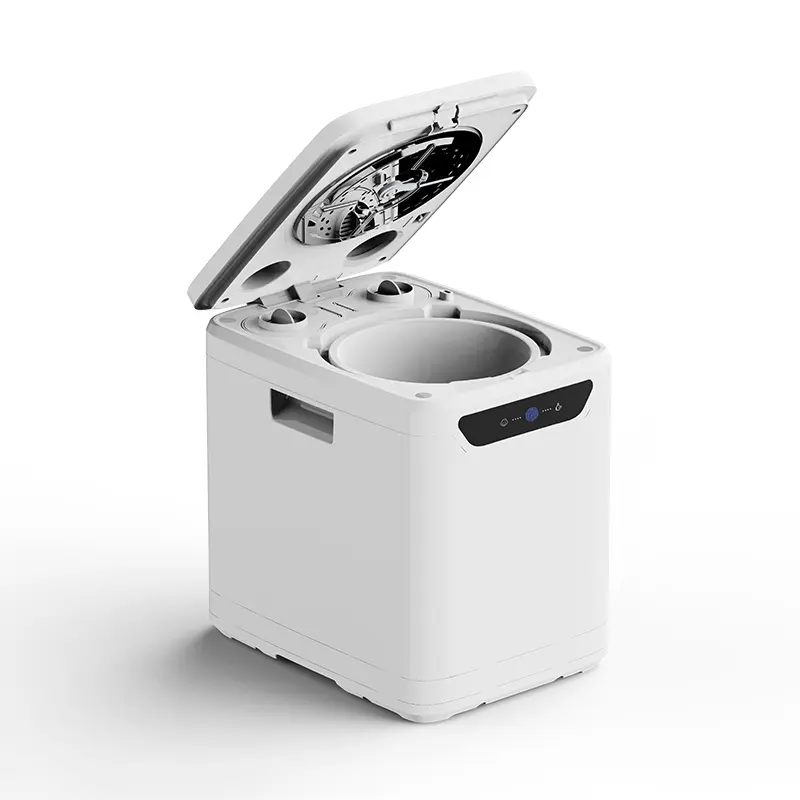 Nanda Turbo Series-3.5L-016
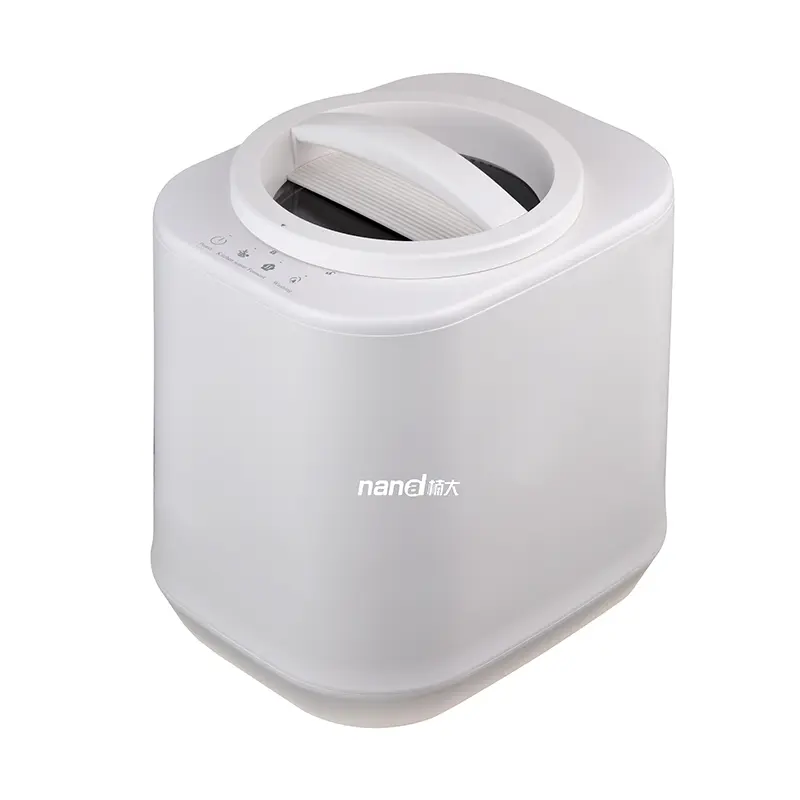 Nanda-Turbo Series-4L-011
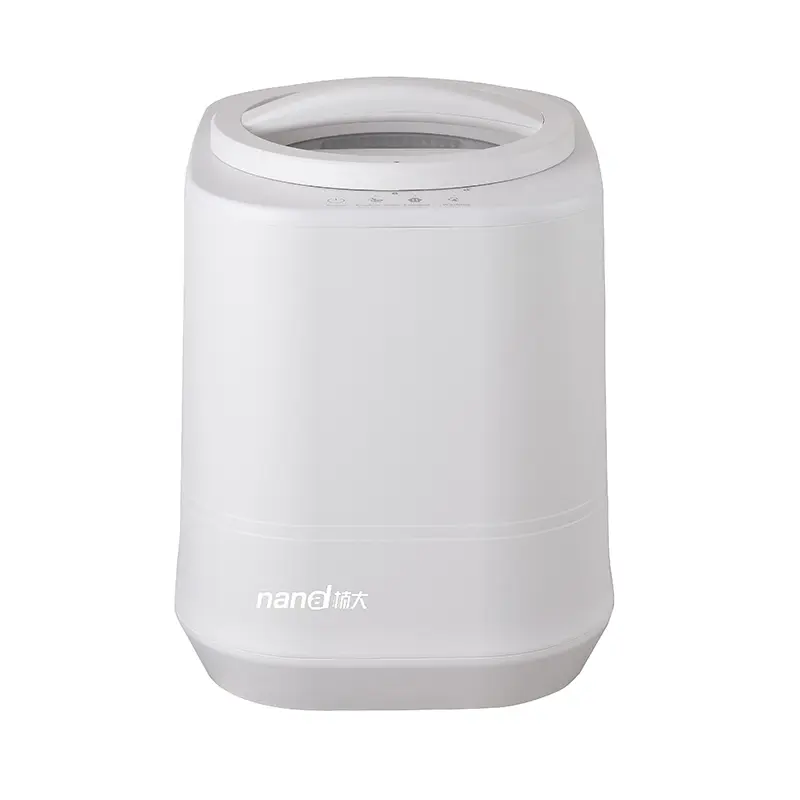 Nanda Turbo Series-4L-012
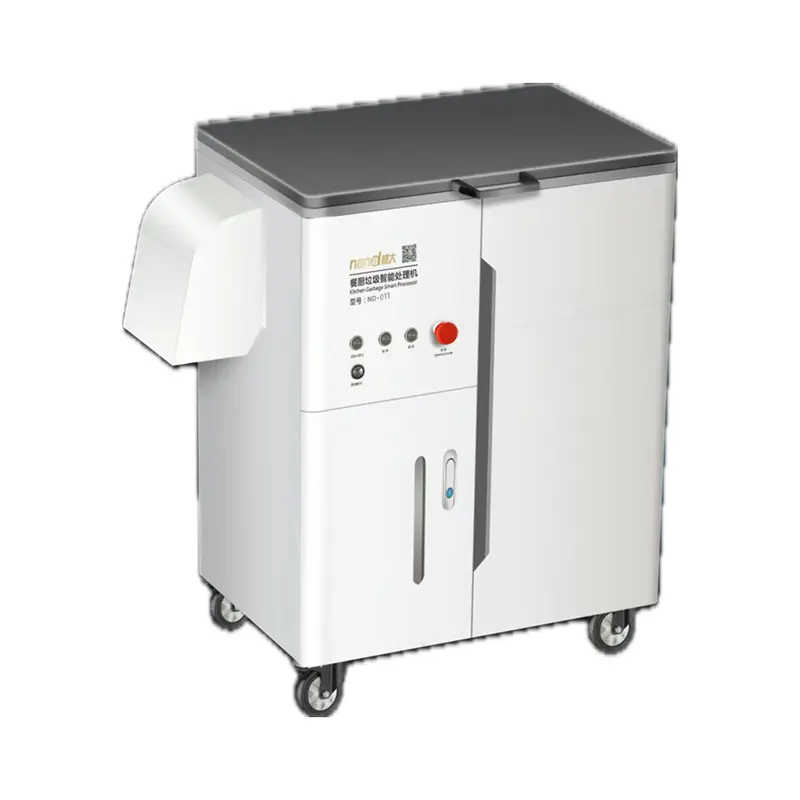 Oil-Water Separator